Impact of GPU Thermal Throttling on LLM Training
Introduction
A single thermally throttled GPU — one out of sixteen — can cut your distributed training throughput by 5×. Not because it crashes. Not because it throws an error. It just runs slower, and FSDP’s synchronous gradient reduction forces every other GPU to wait.
In this post, I show exactly how this plays out on an Azure ND H100 v5 cluster. I stress-test 10 nodes with dcgmproftester, identify the 2 nodes with thermal issues, then run Qwen 2.5-7B FSDP fine-tuning across three configurations: 2 healthy nodes, 1 healthy + 1 thermal, and 2 thermal nodes. Per-step throughput logging reveals the progressive degradation as GPUs heat up during training.
Test Environment
| Component | Detail |
|---|---|
| VM SKU | Standard_ND96isr_H100_v5 |
| GPUs per node | 8× NVIDIA H100 80 GB HBM3 |
| Inter-node | 8× 400 Gb/s NDR InfiniBand (ConnectX-7) |
| Cluster | 10 nodes provisioned |
| Container | nvcr.io/nvidia/pytorch:24.12-py3 (PyTorch 2.6, NCCL 2.23.4) |
| Shared FS | Azure Managed Lustre (/lustre) |
Step 1: Detecting Thermal Issues with dcgmproftester
Before running any benchmarks, I stress-test every node in the cluster to identify hardware problems. The approach is simple:
- Run
dcgmproftester13(target 1004 — FP64 tensor core stress) for 120 seconds on all nodes simultaneously - Monitor
nvidia-smifor thermal slowdown flags during the test - Parse results to find any failing nodes
# Stress test parameters
DURATION=120
TARGET=1004
CURRENT_DATE=$(date +"%Y-%m-%d.%Hh%Mm%Ss")
LOGDIR=$(pwd)

# Launch GPU stress test
dcgmproftester13 --no-dcgm-validation --max-processes 0 \
    -t $TARGET -d $DURATION >> "$LOGPATH" 2>&1 &

# Monitor for thermal throttling during the test
nvidia-smi -q -d PERFORMANCE | grep -i slowdown
The HW Slowdown and HW Thermal Slowdown fields in nvidia-smi change from Not Active to Active when a GPU is being throttled due to temperature. I run this check in a loop during the stress test and flag any node where throttling occurs.
Results: 2 out of 10 Nodes Failed
Out of 10 nodes, 8 passed and 2 failed with thermal throttling:
thermal_results.vmssB3GCE6.1004.120.log:
  [RESULT] vmssB3GCE6 | FAILED due to thermal throttling: GPU11 (HW Thermal Slowdown)

thermal_results.vmssTSERJB.1004.120.log:
  [RESULT] vmssTSERJB | FAILED due to thermal throttling: GPU5 (HW Thermal Slowdown)
Each bad node had only 1 GPU out of 8 with a thermal problem. This is a subtle failure mode — the node doesn’t crash, NHC (Node Health Check) may not catch it in a quick scan, and the job will launch successfully. The only symptom is degraded performance that gets worse over time.
Step 2: Measuring the Impact
To quantify the performance cost, I ran Qwen 2.5-7B FSDP fine-tuning (2 nodes × 8 GPUs = 16 GPUs) with per-step timing across three configurations:
| Scenario | Nodes |
|---|---|
| 2 Healthy | vmss72VTKQ + vmssNTAV11 |
| 1 Healthy + 1 Thermal | vmss72VTKQ + vmssB3GCE6 |
| 2 Thermal | vmssB3GCE6 + vmssTSERJB |
Training configuration:
- Model: Qwen 2.5-7B (7.6B parameters)
- FSDP with
FULL_SHARD, BF16 mixed precision - Sequence length: 2048, micro batch size: 2
- 50 benchmark steps after 5 warmup steps
- IB enabled (
NCCL_IB_DISABLE=0)
The key modification from a standard benchmark: I log timing for every individual step rather than reporting cumulative averages, which would hide the progressive degradation pattern.
Results
Per-Step Throughput
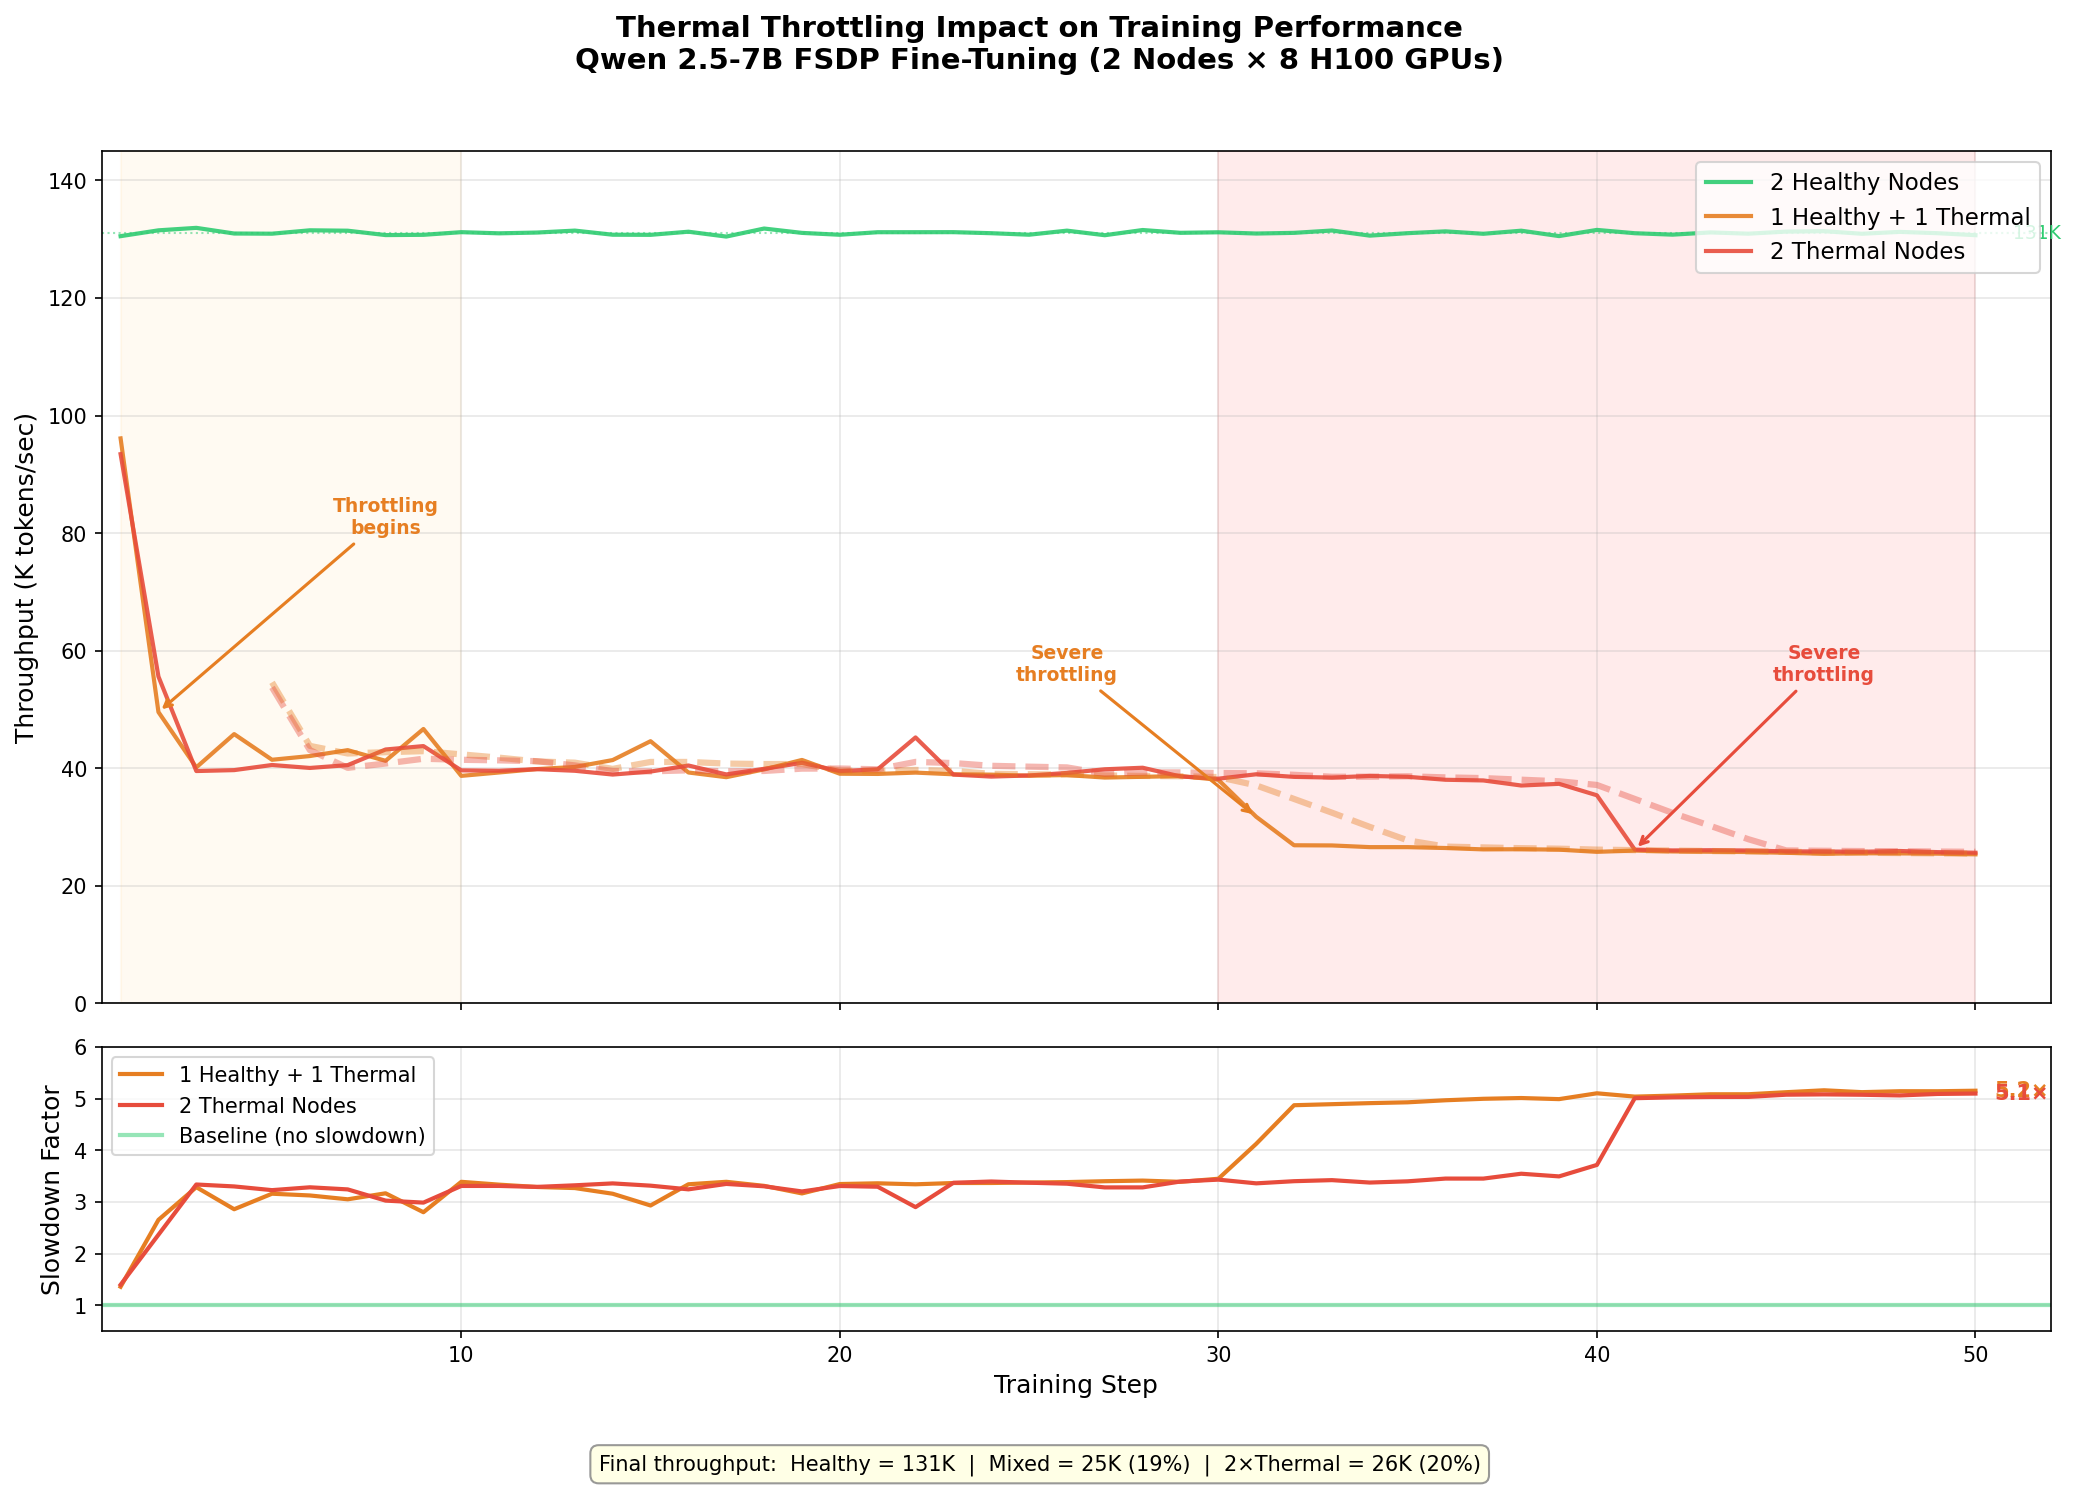
The degradation follows a clear three-phase pattern on the thermal nodes:
| Phase | Steps | Throughput | What’s Happening |
|---|---|---|---|
| Cold start | 1-2 | ~95K tok/s | GPUs are still cool from being idle; near-healthy performance |
| Initial throttle | 3-30 | ~38-42K tok/s | Bad GPU hits thermal limit, clock frequency drops, all other GPUs wait at NCCL barrier |
| Severe throttle | 31-50 | ~25-26K tok/s | Sustained load drives temperature higher, deeper clock reduction |
Summary Table
| Metric | 2 Healthy | 1 Healthy + 1 Thermal | 2 Thermal |
|---|---|---|---|
| Step 1 throughput | 131K tok/s | 96K tok/s | 93K tok/s |
| First 5 steps avg | 131K tok/s | 55K tok/s | 48K tok/s |
| Last 5 steps avg | 131K tok/s | 25K tok/s | 26K tok/s |
| Final slowdown | 1.0× | 5.1× | 5.1× |
| Step time | ~500 ms | ~2,560 ms | ~2,550 ms |
Why 1 Bad Node = 2 Bad Nodes
The most striking finding: 1 healthy + 1 thermal performs identically to 2 thermal nodes at steady state. This happens because FSDP’s all-reduce synchronization creates a hard dependency on the slowest participant:
- Each training step ends with a gradient all-reduce across all 16 GPUs
- NCCL all-reduce is a collective operation — every GPU must participate
- The 1 throttled GPU (out of 16) holds up the all-reduce
- All 15 healthy GPUs sit idle waiting for the straggler
- Adding a second bad node doesn’t make things meaningfully worse — the bottleneck was already established
This is why detecting and excluding even a single bad node matters. The damage is not proportional to the fraction of bad GPUs (1/16 = 6%). It’s catastrophic to the entire job.
Why This Is Easy to Miss
Thermal throttling is insidious because:
- No errors in logs. The job runs to completion. Training loss decreases normally. Nothing looks wrong except wall-clock time.
- Warmup hides it. The first few steps look fine because GPUs haven’t heated up yet. If your benchmark is short or only measures the first few iterations, you’ll miss it entirely.
- Cumulative averages dilute it. Reporting average throughput over the full run shows ~33K tok/s for the mixed scenario — a 4× slowdown. But the actual final steady-state is 25K tok/s — a 5.1× slowdown masked by the fast early steps.
- Standard health checks miss it. NHC and basic nvidia-smi checks show 8 GPUs present, all with memory allocated, driver loaded. You need a sustained stress test to trigger the thermal condition.
Recommendations
-
Run thermal stress tests before any benchmark or training job. Use
dcgmproftesterwith target 1004 for at least 120 seconds. Monitornvidia-smi -q -d PERFORMANCEforHW Thermal Slowdownduring the test. -
Exclude failing nodes automatically. Maintain a hostfile of healthy nodes and use it for all distributed jobs. One bad node out of 100 will throttle your entire training run.
-
Log per-step timing, not just averages. Cumulative averages hide progressive degradation. Per-step timing reveals whether your cluster is thermally stable or slowly deteriorating.
-
Monitor GPU temperature in production. Tools like DCGM, Prometheus exporters, or Azure Monitor can alert when GPU junction temperatures approach throttling thresholds (~83°C for H100).
-
Report failures to your cloud provider. Thermal issues are typically hardware problems (failed fans, degraded thermal interface material) that require physical intervention.
Key Takeaways
- 1 bad GPU out of 16 causes a 5.1× slowdown for the entire distributed training job
- The degradation is progressive — starts at ~1.4× and worsens to 5.1× as GPUs heat up
- 1 bad node performs the same as 2 bad nodes due to synchronous all-reduce
- Standard health checks won’t catch it — you need sustained stress testing
- Always log per-step timing to catch thermal drift in long-running jobs
Related Posts
- Dense vs MoE: IB and GPU Communication Patterns
- IB vs Ethernet Fine-Tuning at Scale
- Monitoring InfiniBand Health on Azure H100 Clusters
This is a personal blog. Opinions and recommendations are my own, not Microsoft’s.
Leave a Comment